Office of Sustainability
CalEnviroScreen 4.0
What Is It?
CalEnviroScreen is a science-based mapping tool that helps identify California communities that are most affected by many sources of pollution, and that are often especially vulnerable to pollution’s effects. CalEnviroScreen uses environmental health, and socioeconomic information to produce a numerical score for each census tract in the state.
The results are depicted on maps so that different communities can be compared to one another. A census tract with a high score is one that experiences higher pollution burden and vulnerability than census tracts with low scores. CalEnviroScreen ranks census tracts based on data that are available from state and federal government sources. CalEnviroScreen 4.0 is the most current version and was released in October 2021.
The CalEnviroScreen 4.0 model is based on CalEPA’s definition of cumulative impacts.
-
The information is based off each census tract in California.
-
It presents information for the entire state on a relative scale to all other census tracts
-
The model is made up of 4 components – Two Pollution Burden components: Exposures and Environmental Effects; and two Population Characteristics components: Sensitive Populations and Socioeconomic Factors.
-
Each component is made up of a set of indicators.
-
There are 13 Pollution Burden indicators and 8 Population Characteristics indicators.

Who Developed It?
-
Office of Environmental Health Hazard Assessment (OEHHA)

-
California Environmental Protection Agency (CalEPA)

Uses
- To identify California’s most environmentally burdened and vulnerable communities.
- To assist CalEPA’s boards and departments with decisions, such as prioritizing resources and cleanup activities.
- Disadvantaged communities in California are targeted for investment of proceeds from the State’s cap-and-trade program. CalEPA designated census tracts with the highest CalEnviroScreen scores as disadvantaged communities for investing cap-and-trade proceeds.
- Used by CalEPA’s Environmental Justice Task Force and other state entities as guidance in allocating grants and in other decisions.

Data Used in CalEnviroScreen
The CalEnviroScreen 4.0 model is based on CalEPA’s definition of cumulative impacts. The model is based on geography, specifically census tracts in California. It presents information for the entire state. The model is made up of 4 components – 2 Pollution Burden components and 2 Population Characteristics components with each component made up of a set of indicators. There are 13 Pollution Burden indicators and 8 Population Characteristics indicators.
-
The model is based on geography, specifically census tracts in California.
-
It presents information for the entire state.
-
The model is made up of 4 components – 2 Pollution Burden components and 2 Population Characteristics components.
-
Each component is made up of a set of indicators.
-
There are 12 Pollution Burden indicators and 8 Population Characteristics indicators.
An indicator is a measure of either environmental conditions, in the case of pollution burden indicators, or health and vulnerability factors for population characteristic indicators.
CalEnviroScreen indicators fall into four broad groups—exposures, environmental effects, sensitive populations, and socioeconomic factors.
-
Exposure indicators are based on measurements of different types of pollution that people may come into contact with.
-
Environmental effects indicators are based on the locations of toxic chemicals in or near communities.
-
Sensitive population indicators measure the number of people in a community who may be more severely affected by pollution because of their age or health.
-
Socioeconomic factor indicators are conditions that may increase people’s stress or make healthy living difficult and cause them to be more sensitive to pollution’s effects.
-
How are scores calculated?
-
Each census tract receives scores for as many of the 21 indicators as possible. Some census tracts will not have scores for every one of the indicators.
-
For each indicator, the scores are put in order from highest to lowest. This allows us to calculate a percentile for all areas that have a score.
-
An average of the indicators that make up a component (Exposures, Environmental Effects, Sensitive Populations, Socioeconomic Factors) is first calculated.
-
The Population Characteristics score for a census tract is the average Sensitive Populations and Socioeconomic Factors component for that census tract.
-
The Pollution Burden score is the average of Environmental Effects and Exposures components, where the Environmental Effects component is weighted one-half because we consider Environmental Effects to make a smaller contribution to Pollution Burden than Exposures do.
-
To get the CalEnviroScreen score we multiply the Pollution Burden score by the Population Characteristics score.

How Are Scores Calculated?

Data for Race and Ethnic Distribution
In addition to the standard Population Characteristics for calculating the CalEnviroScreen Percentile, the report also has information about race and ethnic distribution. The role that race and ethnicity have when pollution burden and population characteristics are highlighted contextualizes the vulnerability and injustice in heavily impacted communities.


Data is statewide.
Geographic Scale
Census tracts from the US Census Bureau (2010 census) are used to represent the locations of communities across California. The average size of a census tract is around 4,000 people and represents a relatively fine scale of analysis. The data was compiled during the period of 2017-2019 and each represents the average throughout the years.

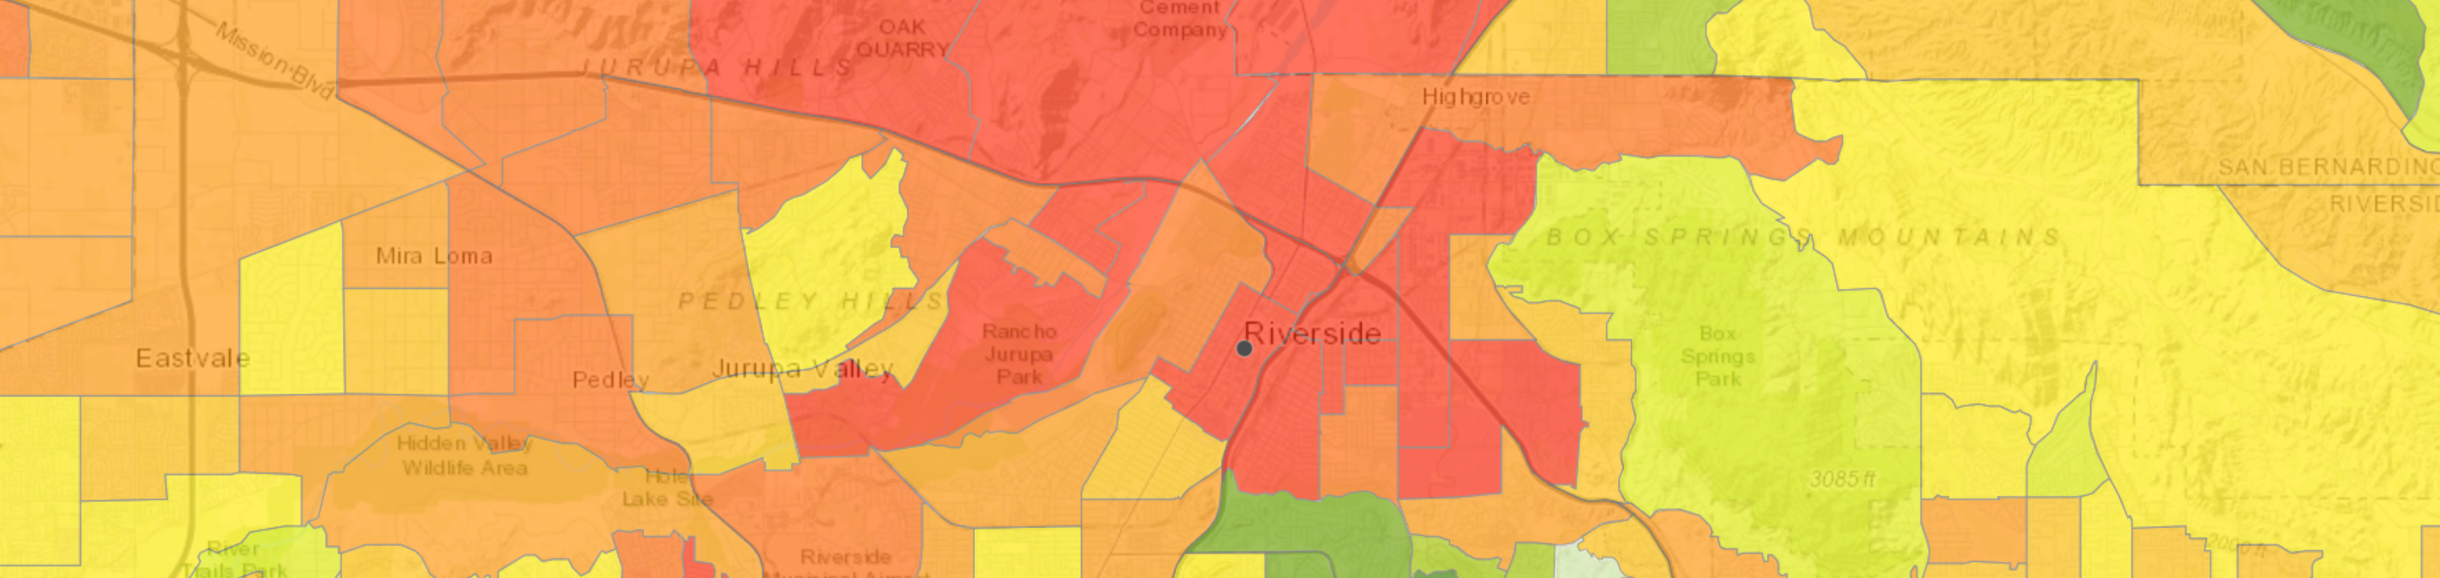
What Does This Mean?
UC Riverside ranks in the highest CalEnviroScreen 4.0 Percentile score of 82%. Previously, UC Riverside Ranked in the CalEnviroScreen 3.0 Percentile score of 90-95%. UC Riverside faces the highest pollution burden and vulnerability among all 10 UC campuses.